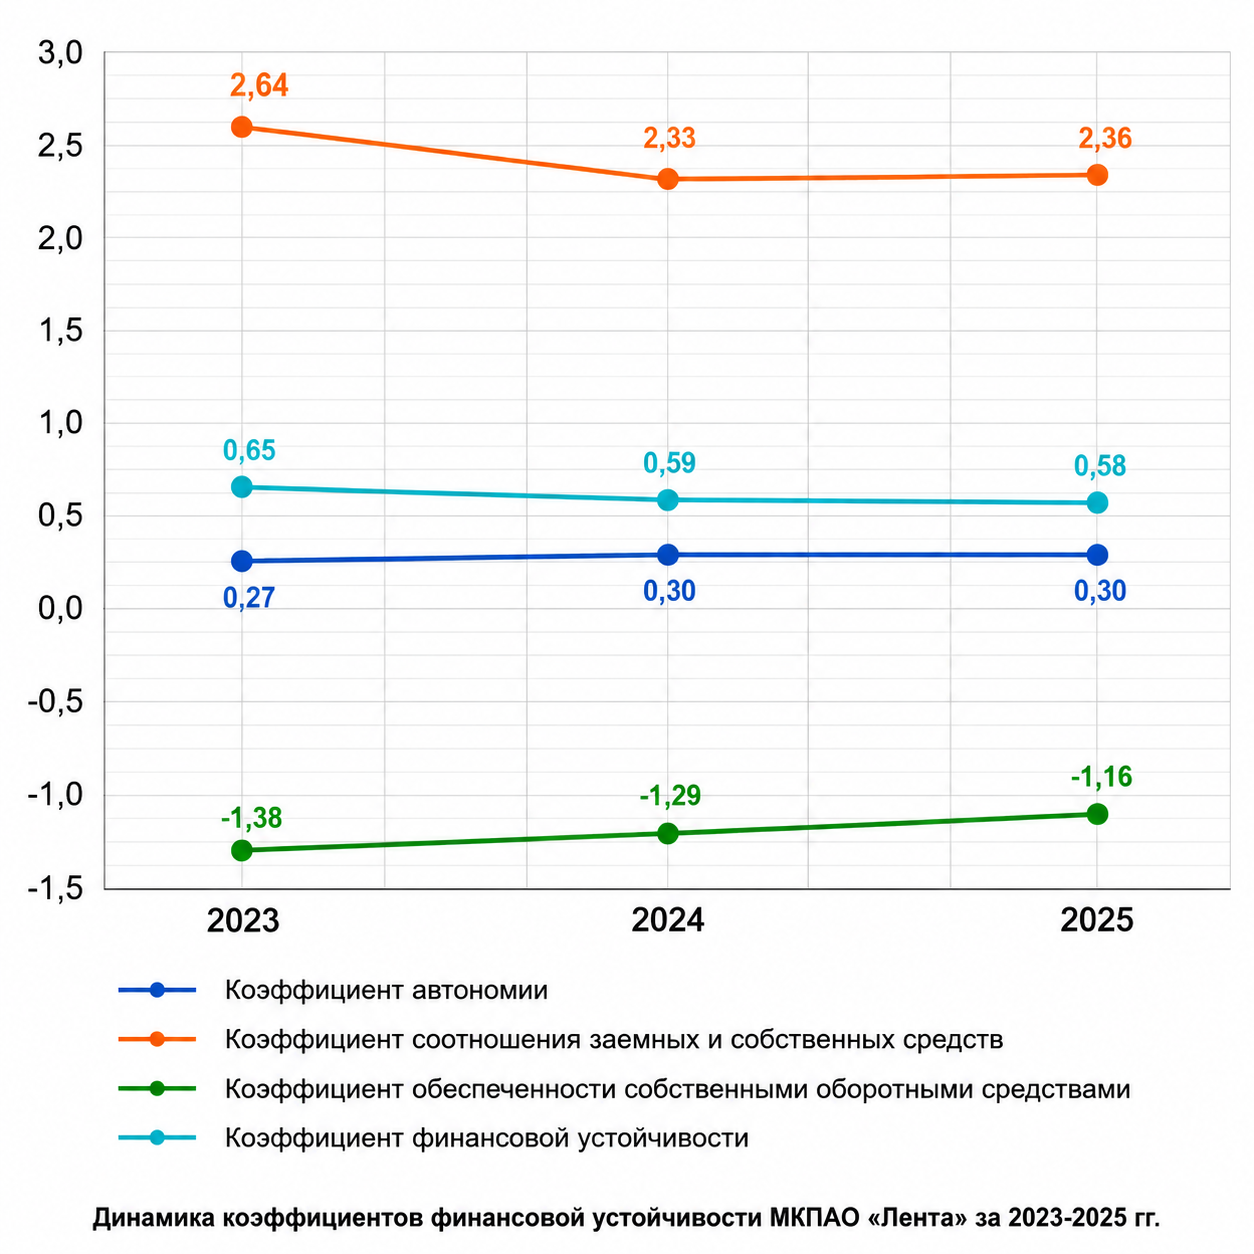


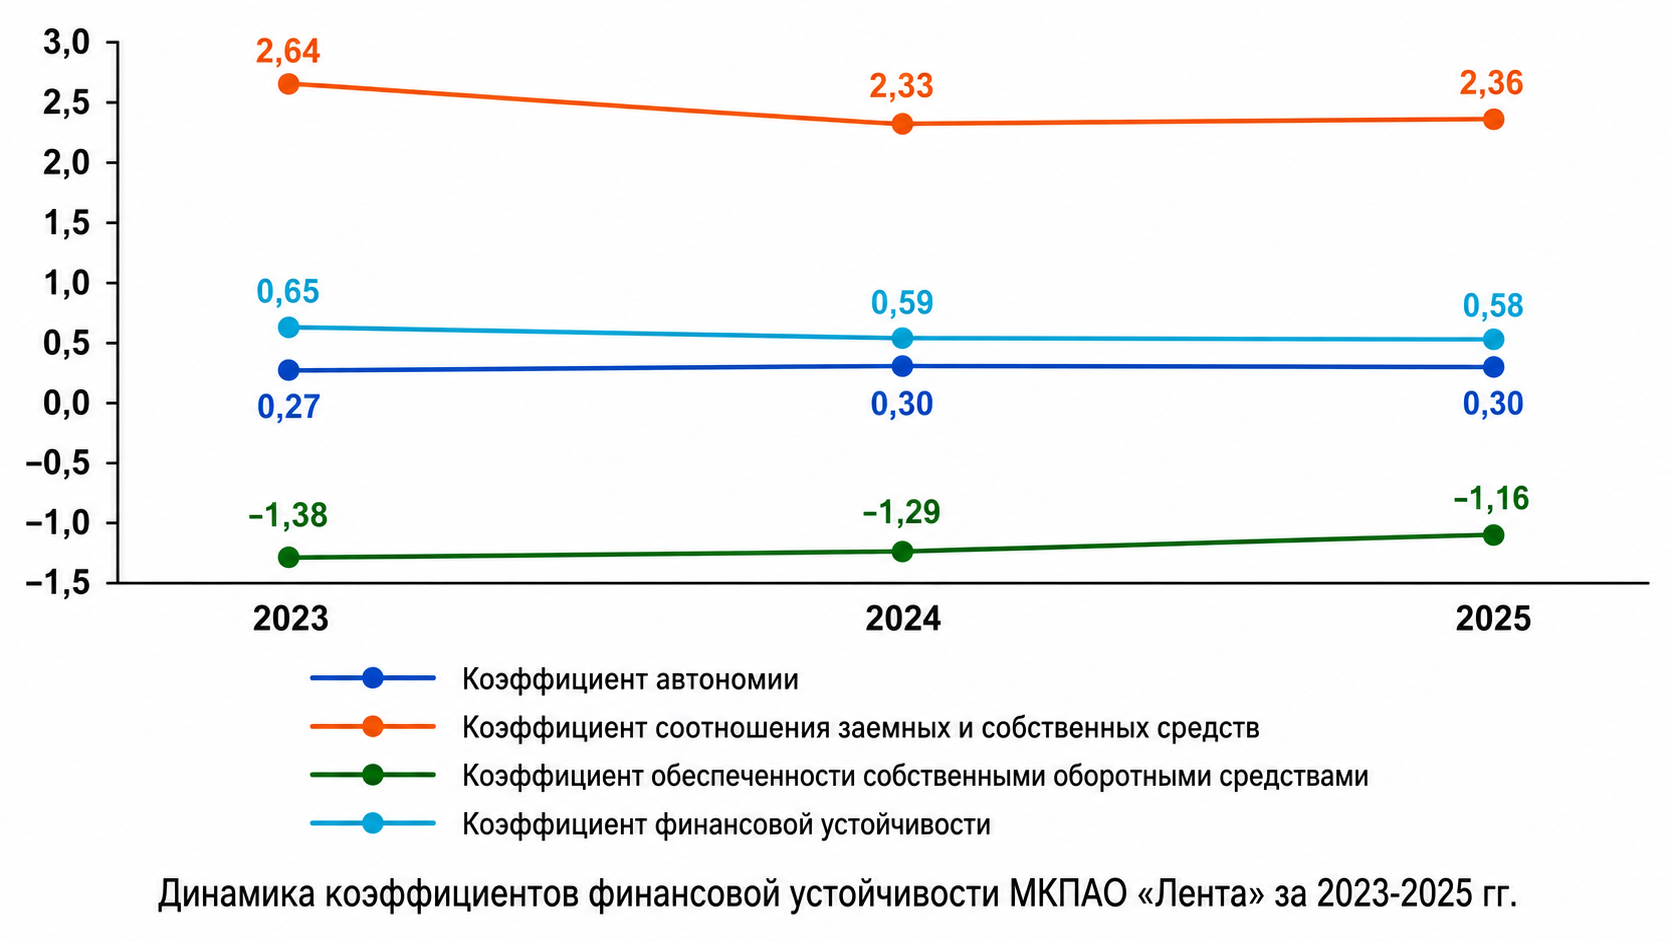
A professional minimalist academic presentation slide, pure white background. Flat corporate infographic design, strict business style, absolutely no 3D, no gradients, no shadows. Large, clear sans-serif fonts (Arial style). A single large line chart in the center. Y-axis on the left with numbers ranging from -1,5 to 3,0 to accommodate all values. X-axis at the bottom with labels: '2023', '2024', '2025'. Line 1: Solid blue line with circular markers. Text values next to markers: '0,27' (2023), '0,30' (2024), '0,30' (2025). Line 2: Solid orange line with circular markers. Text values next to markers: '2,64' (2023), '2,33' (2024), '2,36' (2025). Line 3: Solid green line with circular markers. Text values next to markers: '-1,38' (2023), '-1,29' (2024), '-1,16' (2025). Line 4: Solid turquoise line with circular markers. Text values next to markers: '0,65' (2023), '0,59' (2024), '0,58' (2025). Legend (below chart): - Blue line icon + 'Коэффициент автономии' - Orange line icon + 'Коэффициент соотношения заемных и собственных средств' - Green line icon + 'Коэффициент обеспеченности собственными оборотными средствами' - Turquoise line icon + 'Коэффициент финансовой устойчивости' Footer text centered at the very bottom: 'Динамика коэффициентов финансовой устойчивости МКПАО «Лента» за 2023-2025 гг.'. Highly readable, precise data visualization, clean layout.
Free to start · Generate videos and images with AI in seconds